GOLD, H4
TECHNICAL ANALYSIS
Price is in the large monthly weekly and monthly resistance zones, so this usually gives large swings up and down on the lower time frame like daily, 4 hours and hourly.
4 hour time frame is showing a potential upside move, but that can only be confirmed by break and close of 4 hour candle above pink trendline marked A. The immediate target will be around 1238.92 resistance zone marked by the red horizontal line labelled T
NB:Support/Resistance zones are like balance zones where there is a strong fight between buyers and sellers.(Forces of Demand and Supply). Like all fights, one gives up and the market takes the direction of the winner. If you would like more on Support and Resistance, you can leave a comment below and i will get you more practical applications of those balance zone in the markets.
GBPNZD TECHNICAL ANALYSIS
DAILY
The price is congesting in a triangle marked by R and S trendlines. A break and close above R of daily candle will land into immediate resistance marked P around 2.14856 and break of the zone will land into 2.19965 resistance zone marked by X. On the other hand if daily candle breaks and closes below S trendline, it will land into immediate support zone around 2.07313 marked T from the previous lows and break of the zone will lead to the 2.01839 support zone marked by horizontal line Y.
Short Term Analysis
USDJPY,Hourly
Short term sell will be confirmed by close of the candle below the blue trendline marked T.
The immediate support zone is around 111.975
 AUDJPY,hourly
Short term sell will be confirmed by close of hourly candle below the small blue trendline. The first target will be the 85.143 zone marked by the navy horizontal line
AUDJPY,hourly
Short term sell will be confirmed by close of hourly candle below the small blue trendline. The first target will be the 85.143 zone marked by the navy horizontal line

WHAT HAPPENED
ANALYSIS RESULTS
January - March 2016
NZDJPY, Hourly
The pair performed well as we had analysed in PREVIOUS ARTICLE and hit right into our target.
BEFORE
 AFTER
AFTER
EURUSD, Daily
The pair moved beyond R and reacted in the X trendline zone as we had ANALYSED
BEFORE

AFTER
EURJPY, Hourly.
The pair performed well as in the PREVIOUS ARTICLE and even gave us larger targets.
BEFORE
 AFTER
AFTER
USDCHF, Hourly,
It took longer to confirm but later hit the target as we had PREDICTED
BEFORE
 AFTER
AFTER
GOLD,H4
The pair gave great swing and landed into our target as we had ANALYSED
BEFORE
 AFTER
AFTER
GBPAUD,30MIN
The pair had a tricky movement due to the ECB Interest Rate Decision but never the less it reacted as per our analysis
BEFORE
 AFTER
AFTER
GBPJPY, Hourly
BEFORE
 AFTER
AFTER
 GBPAUD, 30minutes
BEFORE
GBPAUD, 30minutes
BEFORE

AFTER

GBPUSD, Hourly
BEFORE

AFTER
GBPAUD, H4 TECHNICAL ANALYSIS
The pair is in a strongly weekly support zone and this usually gives large wide swings on the lower time frames. The pair is showing a potential upside move on the 4 hour chart which will be confirmed by close of 4 hour candle above the blue horizontal line marked E. The immediate resistance zone/first target is around 1.92529 marked by R and and break and move beyond R will lead to the larger target around 1.94786 marked T
GBPAUD,30MIN TECHNICAL ANALYSIS
The pair is reacting to a large daily support zone hence giving large good swings on the lower time. frames. The 30minute chart shows a potential buy of about 60pips that can only be confirmed by break and close of the candle above the green trendline marked A. The target is around 1.90644 marked by the horizontal line X
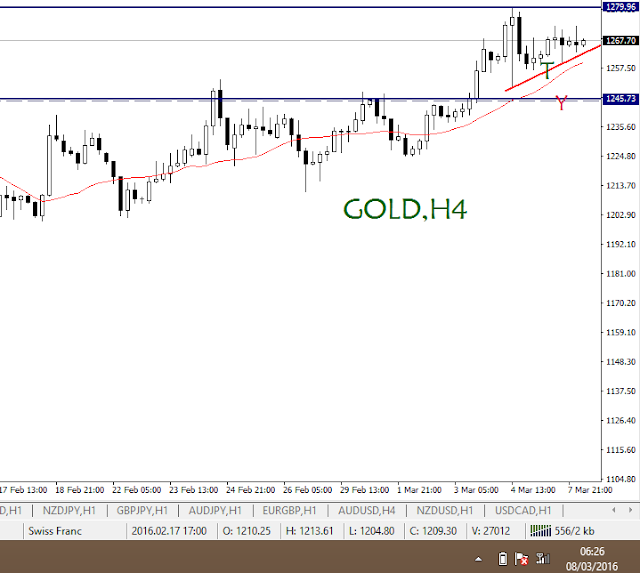
XAUUSD(GOLD) H4, SHORT TERM TECHNICAL ANALYSIS
Gold is reactimg to a major resistance zone but shows a weakness for a short down ward move. But this move can only be confirmed by break and close of a 4 hour candle below red trendline marked T. The target will be around 1245.73 support zone marked by Y
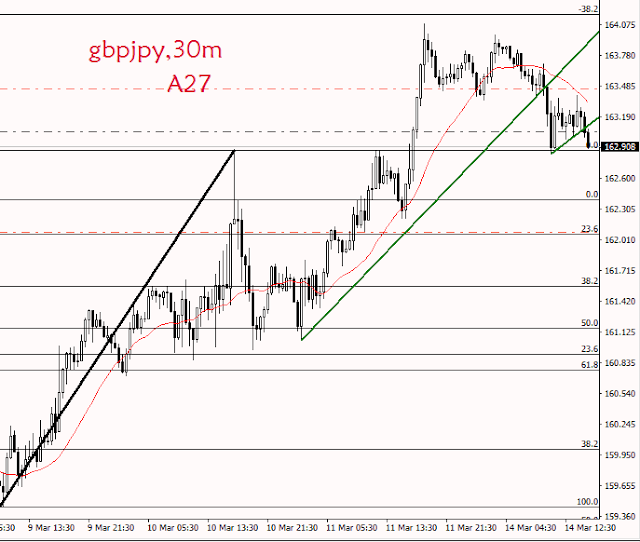
GBPJPY, Hourly Technical analysis.
.
The price is reacting to the resistance zone around 1.39938. The short term sell trade will be confirmed by break and close of the hourly candle below the pink trendline marked T. The target is around 1.39035 zone marked by horizontal line, R.


