Monday 23 May 2016


EURUSD WEEKLY
TECHNICAL ANALYSIS

The price has been reacting to the large weekly and monthly support. The congestion zone is marked by red horizontal lines marked X and Y. Therefore break and close off the X and Y zones will confirm larger movement either way. But for now the trading has been in the highlighted rectangle (congestion zone).
Within the rectangle, price is running in a channel marked by A and B green trendlines. Break and close below A can land price into the 1.09777 support zone marked by the blue horizontal line. This zone is the major pivotal zone within the formed congestion. Break and close below this zone may land price into the lower zones of the congestion marked by the Y red horizontal line around 1.05212.


Monday 16 May 2016


USDJPY,H4

SHORT TERM TECHNICAL ANALYSIS

The price is now reacting in the 21 Simple Moving Average zone. A close below the blue trendline marked X can lead price into immediate support zone around 107.738 marked by horizontal line T. A close  R disqualifies the setup


Tuesday 10 May 2016


USDCAD, H1
SHORT TERM TECHNICAL ANALYSIS

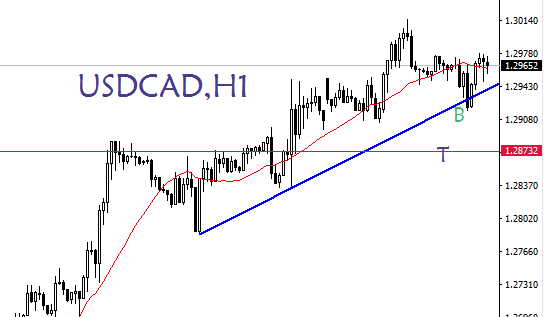
The pair is shifting momentum shown by the slow movement on the large daily resistance zone. A close below trendline B marked by the blue line can lead price to land into support zone around 1.28732 marked horizontal line T


Wednesday 4 May 2016


EURUSD,H4

SHORT TERM TECHNICAL ANALYSIS

The pair is now reacting on the 21 Simple Moving Average support zone on the 4-hourly time frame. A close below pink trendline marked X may land price into immediate support zone around 1.14095 marked by horizontal line T. A close below the zone can bring the price to retest the previous 4-hour lows around 1.12745 zone marked V.