Monday, 13 June 2016


EURAUD,H4

SHORT TERM TECHNICAL ANALYSIS

The price now is a reacting to a support zone marked by A and B horizontal lines. Close above A can lead to retest of 1.5429 resistance zone marked R. Close below B can lead to price to land into the 1.5054 support zone marked by horizontal line T

Friday, 10 June 2016


EURGBP ,H4

SHORT TERM TECHNICAL ANALYSIS

 The major zones to watch for now is the resistance zone around 0.79159 marked by horizontal line R and the support zone around 0.77568 marked S.
A close below blue trendline marked A can lead to retest of the S support zone.


Tuesday, 7 June 2016


TRADING PURE PRICE ACTION WITH A LONG TIME FRAME PERSPECTIVE

It is very important to understand the larger context of the market as you trade. This can be done by analyzing the larger time frames as you go down to the smaller time frames. Trades in direction of trend always perform much better than trades against the trend.It is easier and takes little or no effort to swim with the stream flow than to swim against it.

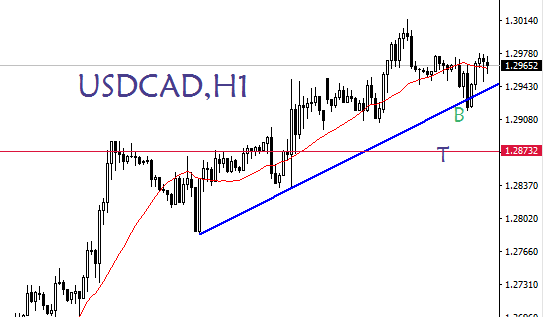
Let me explain it with an example below;

NZDJPY TECHNICAL ANALYSIS

The major trend on the larger weekly and monthly time frames is down after a strong reaction off resistance zone marked R but now it is reacting to a major weekly and monthly support zone marked S evidenced by alot of overlaps on these larger timeframes. But such reaction gives give good swing trading moves on the lower time frames like the daily and the 4-hourly.

Trading on the daily chart is now done within larger blue channel shown below marked A,B formed as the price reacts to the larger monthly support zone. Since the major trend is down, even within the channel there will always be a bearish bias, i;e the down swings within the channel will be stronger than the up swings. Within the blue A,B channel, price has formed another small channel marked X,Y.  Close above X can lead to retest of A and close below Y can lead to retest of B. Price close beyond A or B can lead to larger movements on weekly timeframe

Since the daily trend is now running in the small purple channel marked X,Y, trading on the lower time frames like 4-hour, hourly, 30 minutes is done within this small channel until the daily candle confirms break out of the X,Y channel.

Monday, 23 May 2016


EURUSD WEEKLY
TECHNICAL ANALYSIS

The price has been reacting to the large weekly and monthly support. The congestion zone is marked by red horizontal lines marked X and Y. Therefore break and close off the X and Y zones will confirm larger movement either way. But for now the trading has been in the highlighted rectangle (congestion zone).
Within the rectangle, price is running in a channel marked by A and B green trendlines. Break and close below A can land price into the 1.09777 support zone marked by the blue horizontal line. This zone is the major pivotal zone within the formed congestion. Break and close below this zone may land price into the lower zones of the congestion marked by the Y red horizontal line around 1.05212.


Monday, 16 May 2016


USDJPY,H4

SHORT TERM TECHNICAL ANALYSIS

The price is now reacting in the 21 Simple Moving Average zone. A close below the blue trendline marked X can lead price into immediate support zone around 107.738 marked by horizontal line T. A close  R disqualifies the setup


Tuesday, 10 May 2016


USDCAD, H1
SHORT TERM TECHNICAL ANALYSIS

The pair is shifting momentum shown by the slow movement on the large daily resistance zone. A close below trendline B marked by the blue line can lead price to land into support zone around 1.28732 marked horizontal line T


Wednesday, 4 May 2016


EURUSD,H4

SHORT TERM TECHNICAL ANALYSIS

The pair is now reacting on the 21 Simple Moving Average support zone on the 4-hourly time frame. A close below pink trendline marked X may land price into immediate support zone around 1.14095 marked by horizontal line T. A close below the zone can bring the price to retest the previous 4-hour lows around 1.12745 zone marked V.