Sunday, 20 November 2016


AUDJPY, H4
SHORT TERM TECHNICAL ANALYSIS

Price is now reacting to support zone around 81.085 marked X. Close below X can lead price into Y support zone around 80.484. Close above P disqualifies the setup


AUDCHF
WEEKLY TECHNICAL ANALYSIS

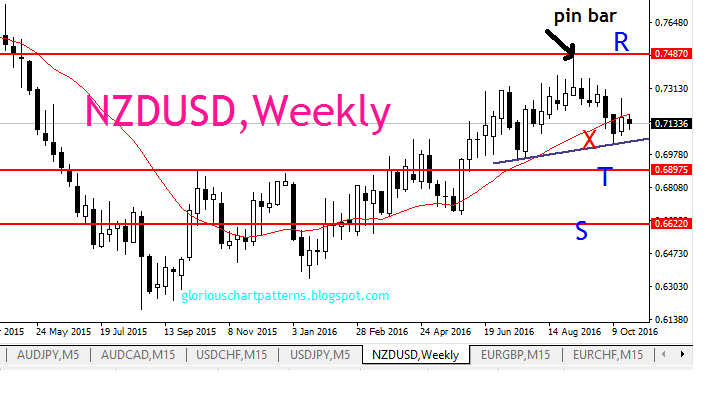
The price is congesting in a triangle marked by the blue trendlines A and B. It is now reacting to the 21 Simple Moving support, the green trendline is next support. Close below the green trendline will price into the bottom of the congestion at B blue trendline. Close below B can lead to the retest of lows into support zone around 0.63893 marked S.
Close above R disqualifies the setup.

Monday, 14 November 2016


ANALYSIS RESULTS AND FOLLOW UP (WHAT HAPPENED)

This follows up the January and March articles

Trading requires alot of patience and discipline.

EURGBP MONTHLY

The pair reacted perfectly just as we had analysed in the previous article . The major swing is complete and now price is reacting to the major previous congestion resistance zone.
                                 Before                                                                                
 

After
AUDJPY, HOURLY

The pair performed much better than we had discussed in the previous article but USDJPY hourly did not confirm our entry

Before

After


GBPNZD,DAILY
The pair had quite a movement from our discussion. From T it retest the trendline S which corresponded with X resiatance zone which gave off a strong sell off into Y. Close below Y was confirmation of the bearish sentiment

Before

After


GOLD, H4
The price reacted perfectly as  as we had discussed with a clear buy entry

Before

After


EURGBP,H4
The movements in price where very clear even for the newbies to pick the short entries as we had analysed

Before

After


AUDJPY,H4

The A resistance zone held perfectly as we had discussed previously
 Before

After

GBPUSD,H4

The strong bearish candle closed below A and Y confirmed the short entry
Before

After

If you would love more charts or analysis of any currency pair. Please leave a comment 


Sunday, 13 November 2016


NZDUSD, DAILY
TECHNICAL ANALYSIS

The price is coming into trendline support zone A which is the same support zone as previous congestion. Reaction strength off this zone will determine which the next market direction is highly likely. The chart below shows probability for downside especially if the high formed off reaction on the support trendline zone doesnt go higher than the high marked by the black arrow. Close above R disqualifies the setup.

Sunday, 30 October 2016


AUDUSD, WEEKLY
TECHNICAL ANALYSIS

The momentum/speed on the upswing marked 2 is much weaker compared to the previous upswing momentum marked 1. This gives the pair a bearish bias. Close below blue trendline marked B can lead price into the previous major support zone around 0.71068 marked S. Close above R disqualifies the setup.


Thursday, 27 October 2016


NZDUSD, WEEKLY
TECHNICAL ANALYSIS

The pair gave off a quick sell for more than a month after a strong reaction from the R resistance zone showed by rejection of prices indicated by the pin bar.

The price is now reacting to previous support zone held by trendline X. Close below X can lead price into support zone around 0.68975 marked T. Close below T may lead price into the S zone around 0.66220. Close above R disqualifies the setup.


Sunday, 23 October 2016


XAUUSD, H4
SHORT TERM TECHNICAL ANALYSIS

Gold is now reacting to a previous support zone also marked by a 21 Simple Moving Average on the 4-hour chart. Close below trendline T can lead price into support zone marked S around 1250.472. Close above resistance R around 1274.655 disqualifies the setup.