Sunday, 13 November 2016


NZDUSD, DAILY
TECHNICAL ANALYSIS

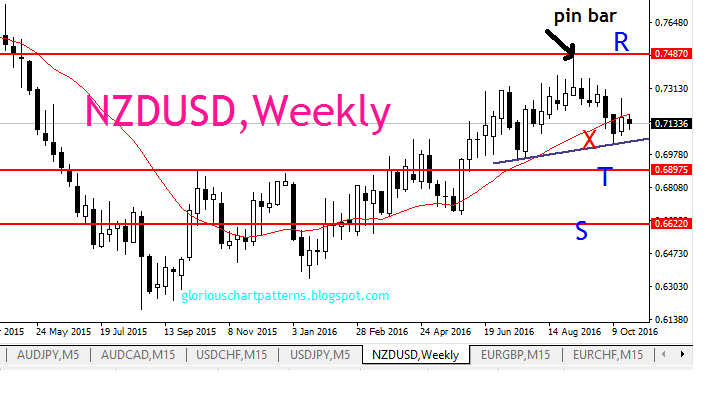
The price is coming into trendline support zone A which is the same support zone as previous congestion. Reaction strength off this zone will determine which the next market direction is highly likely. The chart below shows probability for downside especially if the high formed off reaction on the support trendline zone doesnt go higher than the high marked by the black arrow. Close above R disqualifies the setup.

Sunday, 30 October 2016


AUDUSD, WEEKLY
TECHNICAL ANALYSIS

The momentum/speed on the upswing marked 2 is much weaker compared to the previous upswing momentum marked 1. This gives the pair a bearish bias. Close below blue trendline marked B can lead price into the previous major support zone around 0.71068 marked S. Close above R disqualifies the setup.


Thursday, 27 October 2016


NZDUSD, WEEKLY
TECHNICAL ANALYSIS

The pair gave off a quick sell for more than a month after a strong reaction from the R resistance zone showed by rejection of prices indicated by the pin bar.

The price is now reacting to previous support zone held by trendline X. Close below X can lead price into support zone around 0.68975 marked T. Close below T may lead price into the S zone around 0.66220. Close above R disqualifies the setup.


Sunday, 23 October 2016


XAUUSD, H4
SHORT TERM TECHNICAL ANALYSIS

Gold is now reacting to a previous support zone also marked by a 21 Simple Moving Average on the 4-hour chart. Close below trendline T can lead price into support zone marked S around 1250.472. Close above resistance R around 1274.655 disqualifies the setup.


Thursday, 22 September 2016


EURGBP,H4
SHORT TERM TECHNICAL ANALYSIS

The pair is now reacting to a small pink trendline support marked X and a 21 Simple moving average support. Close below X can lead price into immediate support zone marked P around 0.85593. Close below P may lead price into around  0.85218 support zone marked S. Close above R disqualifies the setup.


Wednesday, 21 September 2016


NZDCHF DAILY
TECHNICAL ANALYSIS

 The pair has continuously reacted off the resistance zone around 0.72235 marked R. It is now reacting to a 21 Simple Moving Average support. Close below the pink trendline marked X can lead price into support zone around 0.70027 marked A which is the same zone as the pink trendline T. Close below T may lead price into the larger support zone marked P around 0.66987


Sunday, 11 September 2016


NZDCAD,H4
SHORT TERM TECHNICAL ANALYSIS


The price is now reacting to a 21 Simple Moving Average support. A close below the blue trendline T can lead price into support zone around 0.94880 marked S.