Sunday, 31 July 2016


EURCAD,HOURLY
SHORT TERM TECHNICAL ANALYSIS

The pair is now reacting to a small trendline support marked T. Close below T can lead price into immediate support around 1.45267 marked Y. Close below Y can lead price into support zone marked X around 1.44582 . Close above resistance marked R around 1.46677 disqualifies the setup.


Thursday, 28 July 2016


AUDCAD,H4
SHORT TERM TECHNICAL ANALYSIS

Price is now reacting to the blue trendline support marked T. Close below T can lead price into support zone around 0.97497 marked A, and close below A can lead price into support zone around 0.96642 marked B. Close above resistance R disqualifies the setup.

Sunday, 17 July 2016


EURUSD, DAILY
TECHNICAL ANALYSIS

The price is now held in a channel formed by trendlines A and B. Close below B can lead price into support zone around 1.08740 marked X. Close below X can lead price into support zone around 1.06612 marked Y. Close above A disqualifies the setup.


Saturday, 16 July 2016


NZDUSD, DAILY TECHNICAL ANALYSIS

The pairs price is currently approaching the green trend-line support zone marked L. Close below L can lead price to go up to the  support zone around 0.68766 marked M.  Close below this support zone M can lead price into support zone marked N around 0.66020.


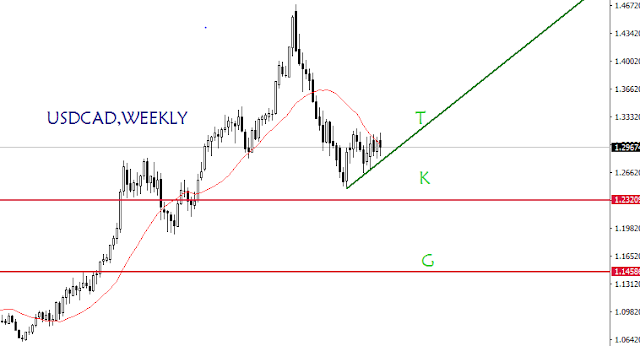
USDCAD,WEEKLY TECHNICAL ANALYSIS

The pair is currently reacting to the green trendline support marked T. Close below T can lead price to go up to the  support zone around 1.23209 marked K.  Close below this support zone K can lead price into support zone marked G around 1.14586.

Tuesday, 12 July 2016


USDCAD,H1
SHORT TERM TECHNICAL ANALYSIS

The pair is reacting to a small green trendline support marked A. Close below A can lead price into support zone around 1.30656 marked T.  Close below T can lead price into support zone marked S around 1.30251


Sunday, 10 July 2016


GBPCAD, Hourly
SHORT TERM TECHNICAL ANALYSIS

The price on the hourly chart is now reacting to a 21 Simple Moving Average support. A close below the green trendline marked K can land price into support zone around 1.68340 marked H. Close below H can lead price into support zone marked M around 1.67621

Monday, 4 July 2016


SHORT TERM TECHNICAL ANALYSIS
NZDCHF, H1

The price is now reacting to a small trendline support, marked X. A close below the trendline can land price to support zone around 0.69630 marked Y and close below that zone can lead to retest of 0.69278 support zone marked Z.


NZDUSD, HOURLY
SHORT TERM TECHNICAL ANALYSIS

The price is now being held by a 21 Simple Moving Average support zone. A close below green trendline marked X can lead price into support zone around 0.71338 marked by horizontal line A. Close below A can land price into 0.71067 support zone marked B and close below B can lead price into larger support zone around 0.70634 marked C. Close above Y disqualifies the setup.